Battery Cell Matching Mistakes: What Capacity Distribution and Pack Configuration Really Change
Practical lessons from four battery-pack optimization experiments using 84 synthetic lithium-ion cells and the BetaWA Pascal Core engine.
Reusing lithium-ion cells from electric vehicles and other battery systems can be an attractive way to build second-life energy storage. However, cells with similar nominal specifications do not necessarily form a well-balanced battery pack. Even when every cell has been measured, the final result depends on more than the difference between the highest and lowest capacities.
The distribution of cell capacities, the number of cells connected in parallel, and the grouping method can all affect the outcome. To demonstrate this, we tested two sets of 84 synthetic lithium-ion cells using the operational BetaWA Pascal Core engine. Both datasets had the same average, minimum, and maximum capacities. Only their capacity distributions differed. We then tested each dataset in two configurations: 14S3P and 14S4P.
1. Mistake: Assuming Similar Capacity Ranges Mean Similar Results
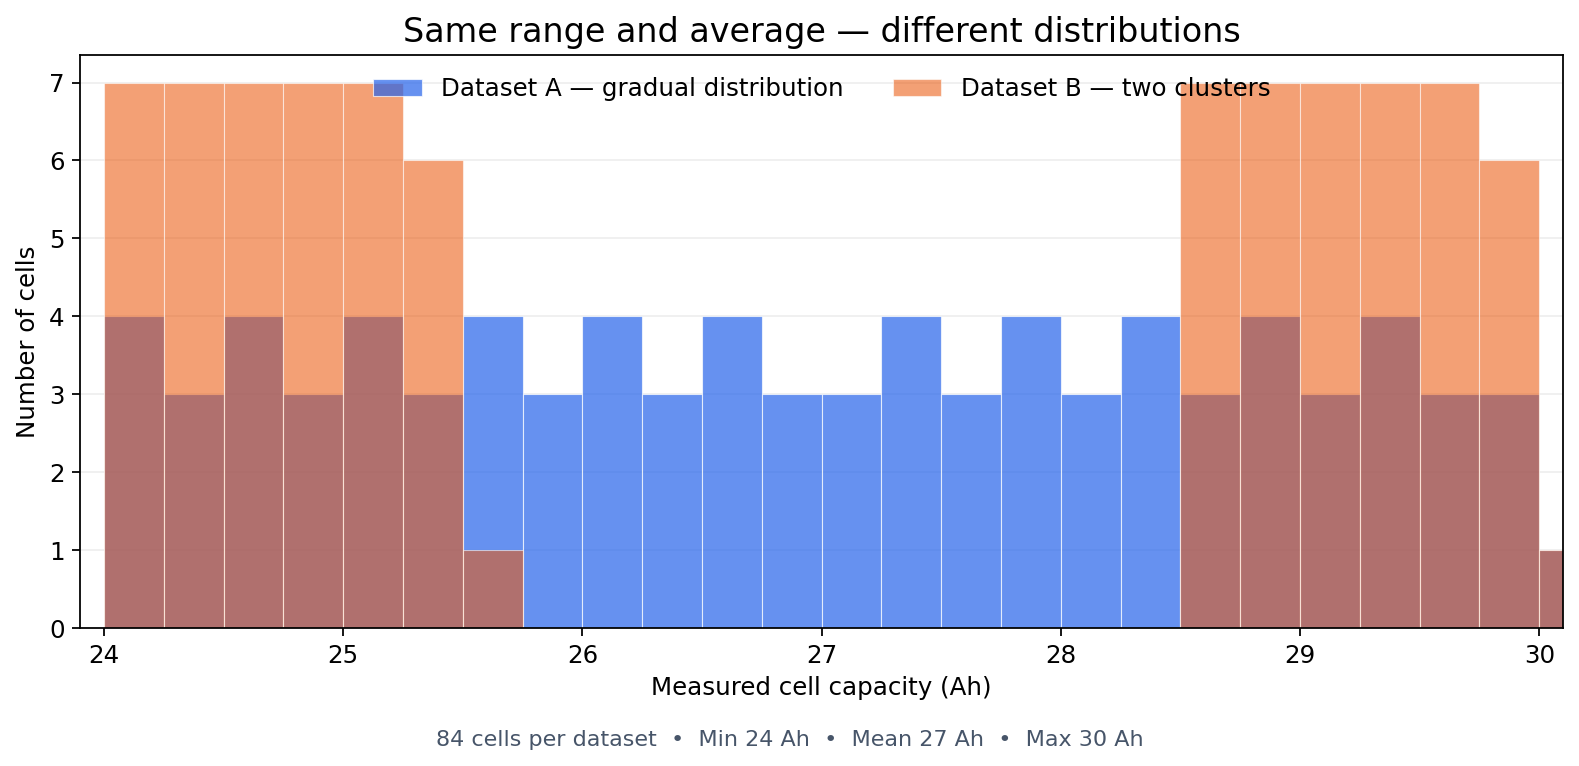
Imagine two inventories of used lithium-ion cells. Both contain 84 cells, with measured capacities ranging from 24 Ah to 30 Ah and an average of 27 Ah. At first glance, the inventories appear comparable. But their distributions are different.
Dataset A: Gradual distribution. Cell capacities are spread relatively evenly across the 24–30 Ah range.
Dataset B: Two distinct clusters. One group has capacities between approximately 24 and 25.5 Ah; another falls between approximately 28.5 and 30 Ah, leaving a substantial gap.
Both inventories have the same overall capacity range and average. Yet the combinations available for building parallel groups are very different. A capacity histogram can reveal information that minimum, maximum, and average capacity cannot.
2. Mistake: Ignoring the Number of Cells in Each Parallel Group
In an S×P battery configuration, S represents the number of series-connected groups, while P represents the number of cells connected in parallel within each group.
- 14S3P: 14 series groups of three parallel cells — 42 cells per complete battery.
- 14S4P: 14 series groups of four parallel cells — 56 cells per complete battery.
The total capacity of a parallel group is approximately the sum of its individual cell capacities, assuming compatible cells operating under suitable conditions. For series-connected groups, usable pack capacity is constrained by the groups that reach their operating limits first. Changing P changes which combinations are possible: an inventory difficult to balance in groups of three may be easier in groups of four.
3. Four Real Optimization Experiments
We used the same two synthetic datasets and the operational BetaWA Pascal Core engine. Each contained 84 cells, with capacities between 24 and 30 Ah and a mean of 27 Ah. We requested a 0.20% capacity tolerance. For 14S3P, we requested two complete batteries; for 14S4P, one.
| Result | A: 14S3P | B: 14S3P | A: 14S4P | B: 14S4P |
|---|---|---|---|---|
| Complete batteries | 2 | 1 | 1 | 1 |
| Cells in complete batteries | 84 | 42 | 56 | 56 |
| Cells in incomplete groups | 0 | 39 | 28 | 28 |
| Unused cells | 0 | 3 | 0 | 0 |
| Capacity spread | 0.0891% | 5.6001% | 0.0000% | 0.0002% |
| 0.20% tolerance achieved | Yes | No | Yes | Yes |
Capacity Spread (%) = (Maximum group capacity − Minimum group capacity) ÷ Mean group capacity × 100. This metric is calculated separately for each complete battery.
Dataset A: 14S3P
The gradual distribution produced two complete 14S3P batteries using all 84 cells. Both achieved approximately 0.0891% spread, with parallel-group capacities between 80.9639 Ah and 81.0361 Ah — within the requested tolerance.
Dataset B: 14S3P
The two-cluster distribution produced one complete 14S3P battery. Its group capacities ranged from 78.7318 Ah to 83.2682 Ah, giving 5.6001% spread, far above the target. The remaining inventory included 39 cells in incomplete groups and three unused cells. This does not prove that a better 14S3P solution is mathematically impossible: it is the result found by the tested engine in this run.
Dataset A: 14S4P
With four cells per parallel group, BetaWA produced one complete battery using 56 cells. All fourteen groups were reported at 108 Ah, yielding a displayed spread of 0.0000%. The remaining 28 cells were in incomplete groups. The deliberately symmetrical synthetic capacities favor such complementary combinations.
Dataset B: 14S4P
Changing the clustered dataset from P=3 to P=4 produced one complete battery with group capacities between approximately 107.9999 Ah and 108.0001 Ah. The reported spread fell to 0.0002%, meeting the target. This configuration used 56 cells in the complete battery, however, rather than the 84 needed for two 14S3P batteries.
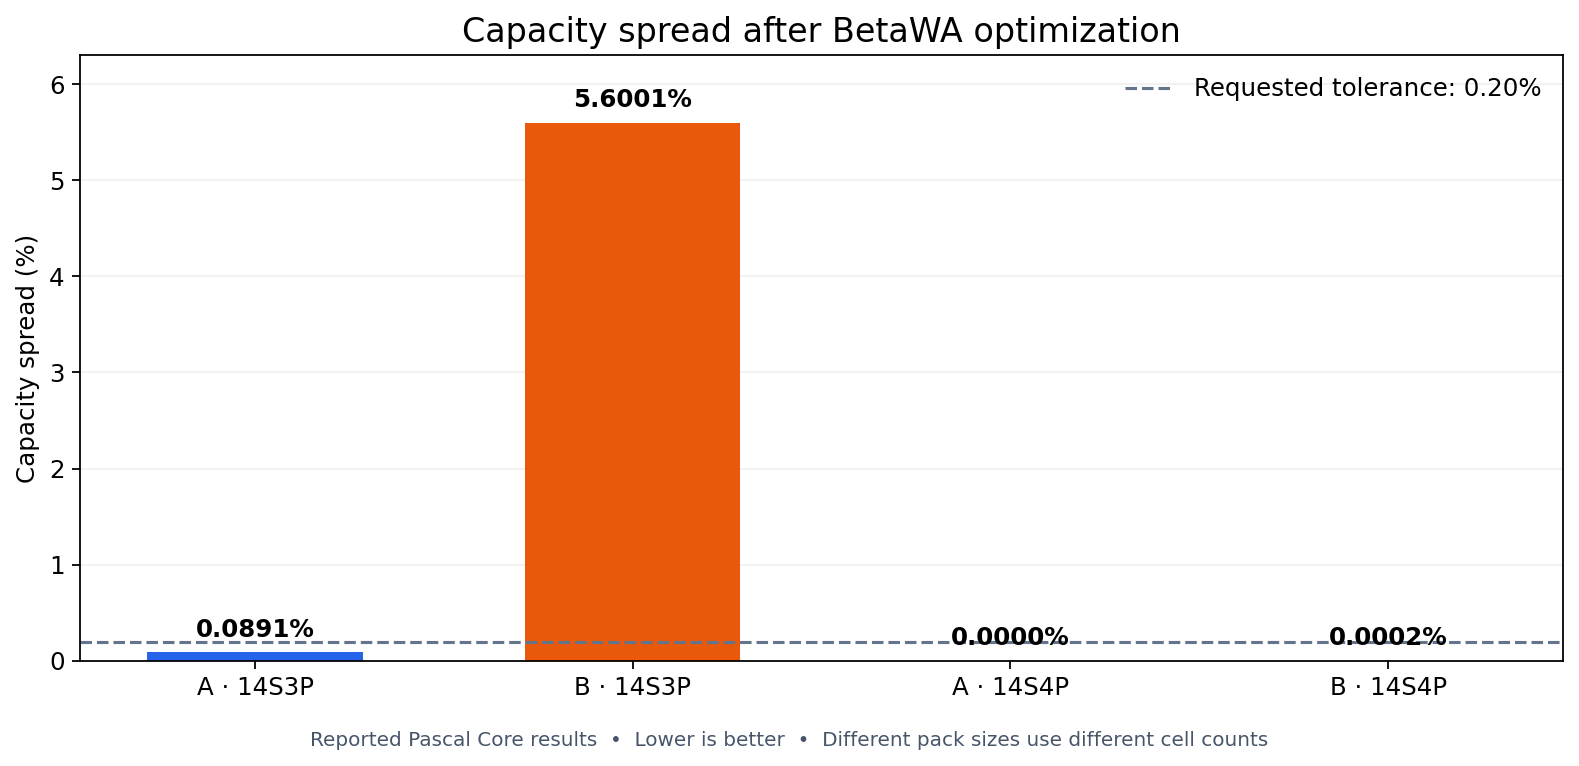
Better capacity matching does not automatically mean more complete batteries or better overall inventory utilization.
4. Mistake: Treating Requested Tolerance as a Guaranteed Result
An optimization tolerance is a target, not a promise. In these tests, three configurations achieved the requested 0.20% spread, while Dataset B at 14S3P returned 5.6001%. A successful calculation does not necessarily mean the assembly satisfies the engineering requirement. BetaWA reports the achieved spread so the user can evaluate the actual result.
5. Mistake: Assuming a BMS Can Replace Capacity Matching
A Battery Management System (BMS) is essential to the safe operation of many lithium-ion systems. Depending on its design, it monitors cell-group voltages, temperatures and current, manages operating limits, performs protective functions and balances state-of-charge differences. But state-of-charge balancing and capacity matching are not the same thing.
Consider two series-connected groups with capacities of 40 Ah and 50 Ah. Even if both start fully charged, the lower-capacity group will generally reach its discharge limit sooner under comparable conditions. A conventional BMS cannot restore the missing physical capacity. Capacity matching and BMS protection therefore perform complementary functions.
Existing electronics in reused modules do not automatically guarantee compatibility with a newly assembled system. Advanced individual-converter architectures can manage differences more flexibly but add electronics, control complexity, losses and design constraints. BetaWA is a capacity-matching tool, not a replacement for a BMS or safety validation.
6. Mistake: Ignoring Internal Resistance and Self-Discharge
Capacity is only one characteristic of a used cell. Two cells with nearly identical measured capacities can behave differently under load because of internal resistance. Higher resistance may increase voltage drop and heat generation; excessive self-discharge may cause drift during storage or operation.
Practical qualification also requires checks of resistance, self-discharge, physical condition, temperature behavior and other safety and performance characteristics. Cells with incompatible chemistries or voltage ranges are not interchangeable simply because their capacities match.
7. What These Experiments Actually Demonstrate
Inventories with identical summary statistics can produce very different optimization outcomes. The number of parallel cells changes available combinations. Low spread must be considered alongside complete-battery count and inventory utilization. And a solution not found by one optimizer is not necessarily impossible.
These were four individual runs on intentionally constructed synthetic datasets, not a statistical benchmark. Symmetrical capacity values especially favor near-perfect P=4 combinations. Real recovered cells introduce measurement uncertainty, aging differences and additional electrical constraints. These experiments illustrate configuration sensitivity and engine behavior, not typical field performance.
8. Practical Checklist Before Matching Used Battery Cells
- Measure capacities under consistent, appropriate conditions.
- Examine the full distribution, not only mean and range.
- Exclude damaged, incompatible or otherwise unsuitable components before optimization.
- Compare realistic S×P configurations.
- Check achieved spread for every complete battery.
- Review complete batteries, incomplete groups and unused cells.
- Verify chemistry, voltage limits, resistance, self-discharge, thermal behavior, BMS compatibility and protection.
- Treat optimization as an engineering input, not safety certification.
Conclusion: Better Matching Starts with Better Decisions
The same 84-cell inventory can behave very differently depending on its capacity distribution and configuration. Dataset A produced two closely matched 14S3P batteries. Dataset B produced a poor 14S3P result, but at 14S4P its reported spread fell to approximately 0.0002%.
The lesson is not that four parallel cells are always better than three. Capacity distribution, configuration and optimization method must be considered together.
Explore Your Own Battery Cell Inventory
BetaWA uses a Pascal-based optimization engine to group measured battery cells or modules and report achieved capacity spread.
Try the BetaWA Battery Pack OptimizerRelated reading
- Battery Cell Matching by Capacity
- How to Build a Balanced Battery Pack from Used Lithium Cells
- How to Reuse Nissan Leaf Battery Cells